(Showing how) the whole world rang the fish doorbell this season
Every spring, thousands of fish swim through Utrecht’s canals on their way to the Kromme Rijn to spawn. Along the way, they reach the Weerdsluis, a historic lock that is still operated by hand. When the lock gates are closed, the fish have to wait, using up valuable energy and making them easy prey for birds and predatory fish.
To help them on their journey, an underwater camera has been installed at the lock and connected via livestream to a website, de visdeurbel. When you see a fish you can press the doorbell and a snapshot is created and saved.
Last year Moan redesigned the website and I implemented it in code.
This year just under a million unique users tuned into a live stream at a lock in Utrecht. The fish doorbell is one of my favourite projects in my portfolio, it’s not as slick or motion heavy as others I created, but it more than makes up for that in wholesomeness.
Data visualisations and bad puns
Last year after the season ended I got an email from Paul from Moan asking if I had any good ideas for next year’s season:
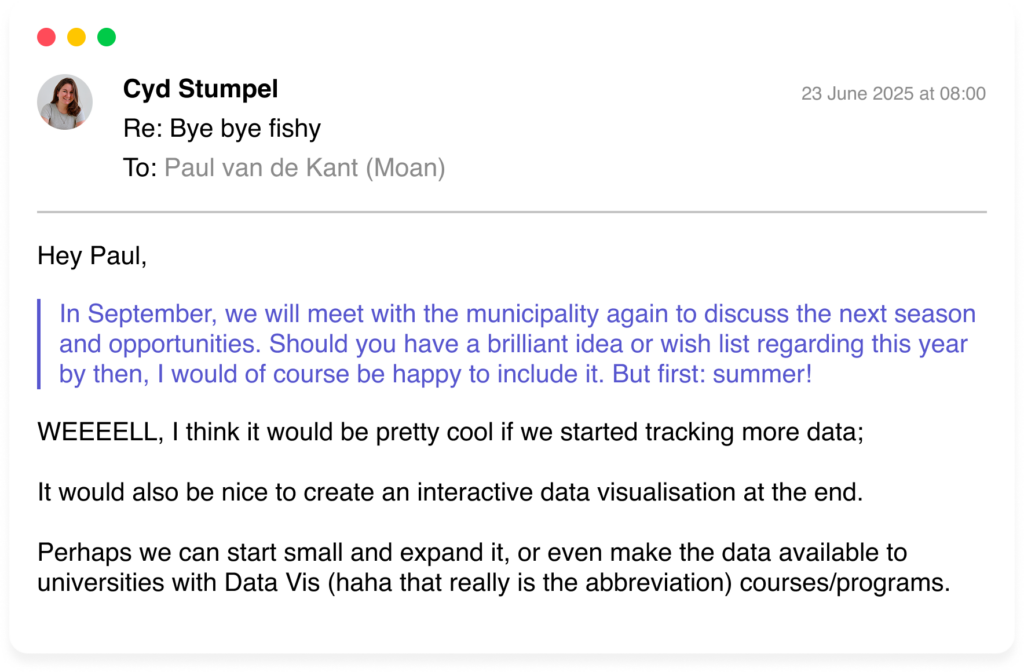
A lot of bad puns about data fishualisations followed, and this year we started to collect anonymous data every time someone pressed the fish doorbell in Umami. Umami is a GDPR friendly tracking software that doesn’t require cookies to be set.
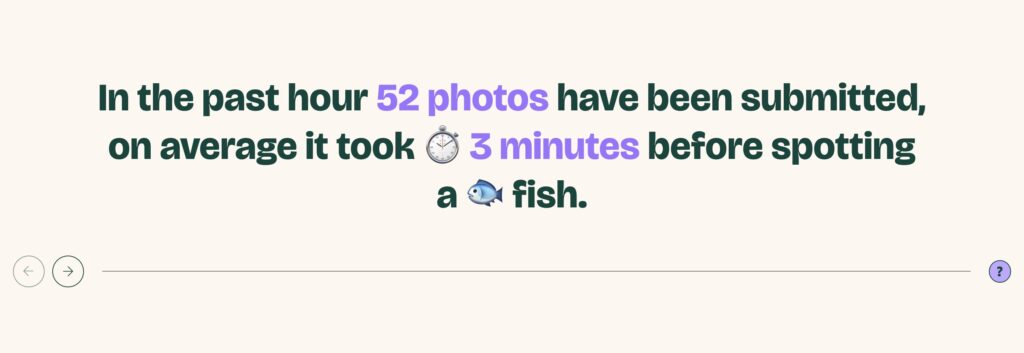
Every hour during the season we showed live data on how the fish doorbell was used, for example how many screenshots were sent in and how long people on average had been watching, but also where people were watching from.
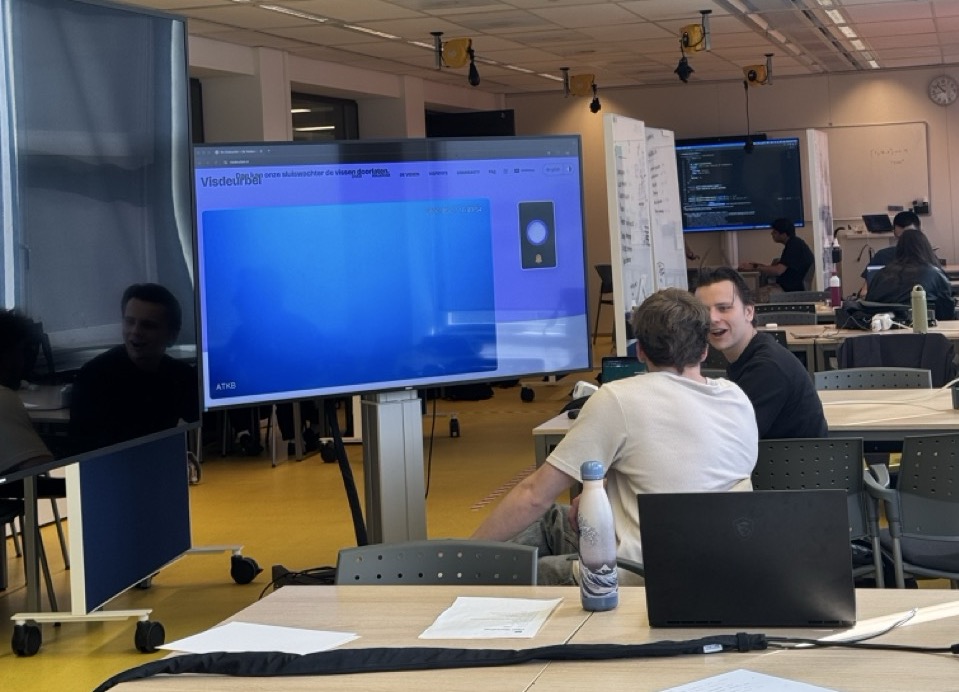
My budget for the data visualisations was enought for just two days work, so we had to be scrappy with our time, that’s where my students came in!
Students
For the final project of the Minor Web Design and Development, students work on projects for real clients. This seemed like the perfect place to explore what was possible to do with the data!
Our brief to the students had some constraints, like that our styleguide needed to be followed because it would be implemented directly into the existing website, but otherwise was really free: “We want to see various data visualizations, preferably a one-pager; the page will be integrated into the existing website. The website must be fully accessible (WCAG A compliance); additionally, the website is visited from all over the world, so consider performance.”
Two groups of students reported weekly to Paul from Moan, and created some really cool concepts which we were able to continue work on.
The Minor Web Design and Development is a minor by the Bachelor Communication and Multimedia Design (CMD) at the Amsterdam University of Sciences, most of the minor’s students also come from that bachelor and are really good at iterating and creative thinking.
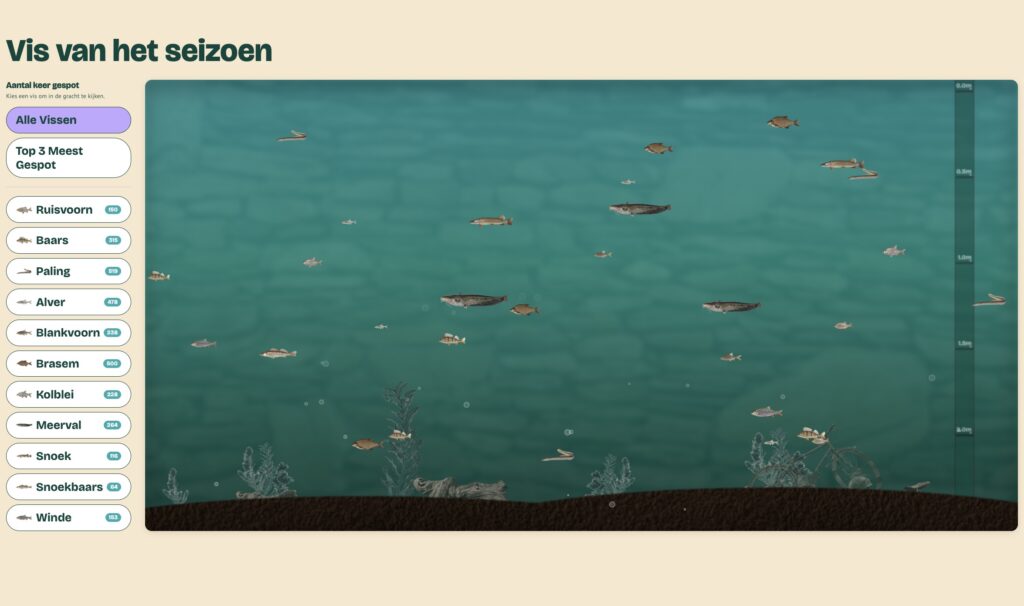
Some of the visualisations were really cool, but unfortunately the data wasn’t very trustworthy. For example: the spotted fish data; we noticed that a lot the snapshots that were empty still had fish attached by users. That’s why we opted for now to not use these visualisations.
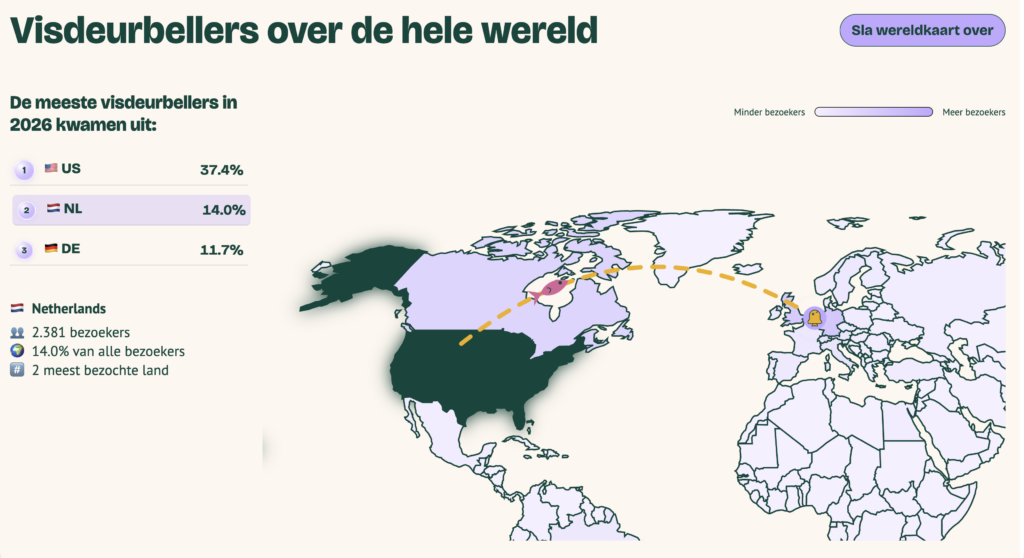
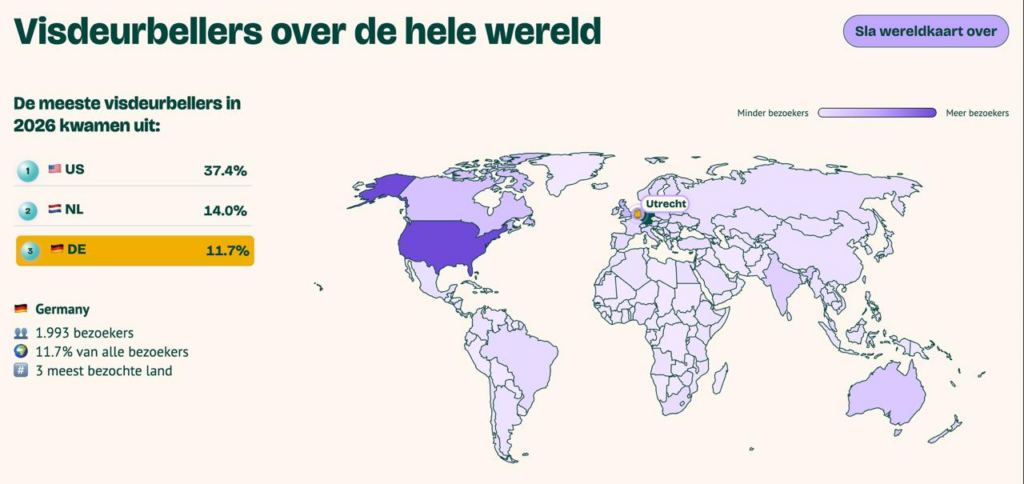
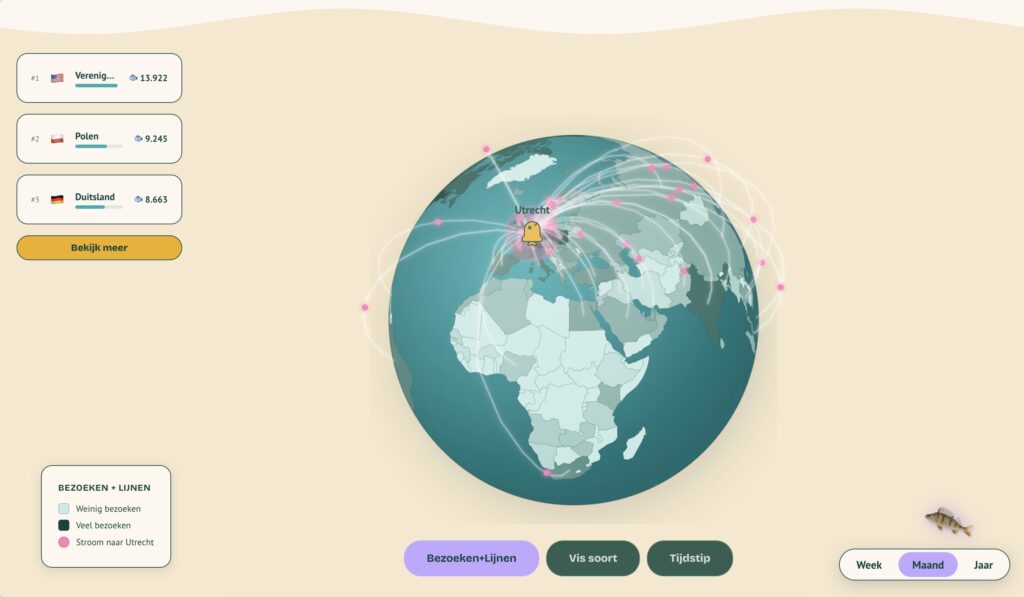
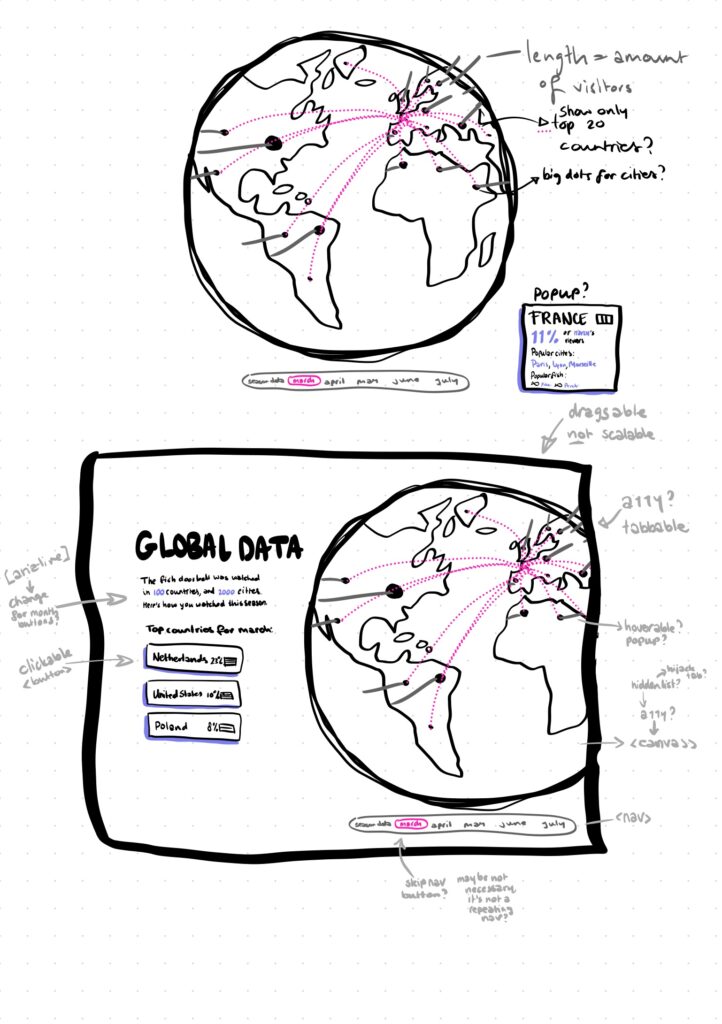
Both groups built a world-map feature, and we combined elements from each for the final visualisation.
We want to thank the students for creating these cool concepts that helped us develop the final data visualisations: Diego Rámon Schluter, Jacco Mols, Joost Krebbers, Julius Gerth, Mats van der Zwan, Mitchell Scholte, Nienke Buursink and Rafi IJssel. You can read more about their work in the design rationales they wrote here: team Ding Dong and team Vis.
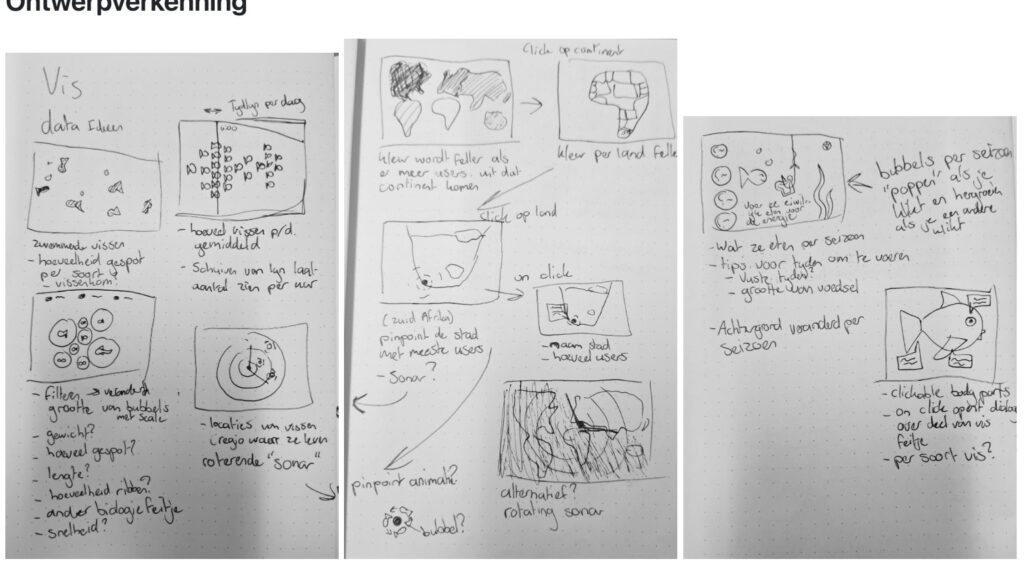
The final visualisations
As a former CMD student myself I also try to still apply the creative, iterative thinking I learned at school to my current work. So of course I had to start with sketching:
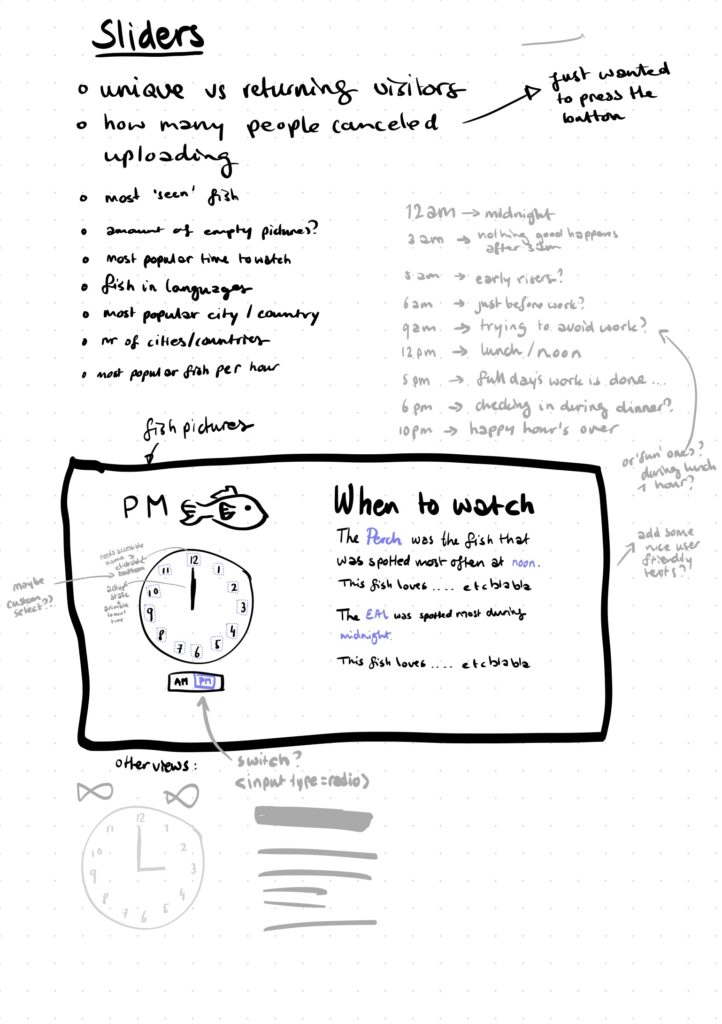
I soon had to dismiss the idea for the spotted fish per time of day visualisation due to time, unfortunately, but we might revisit it next year.

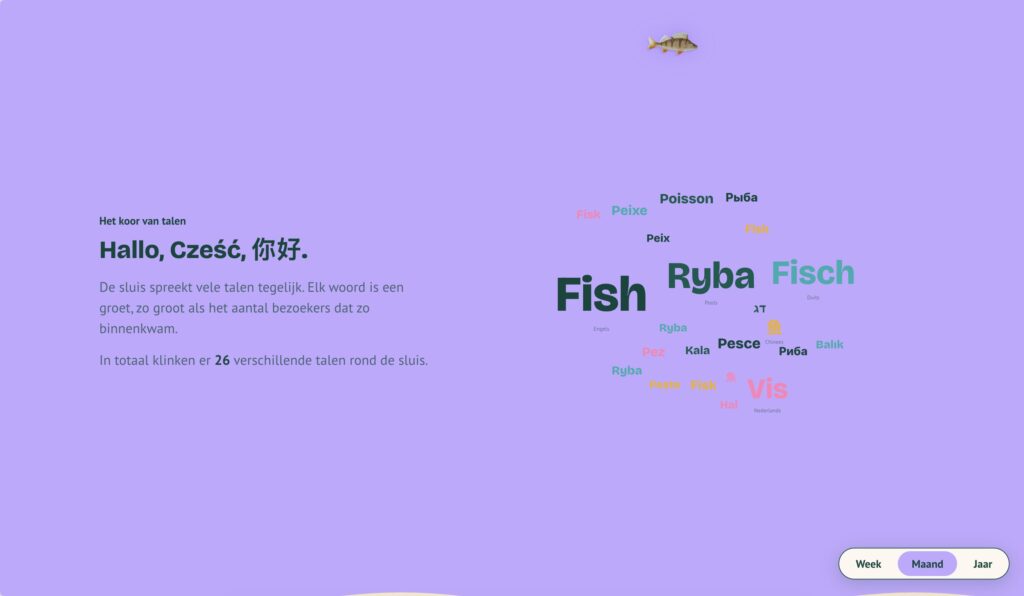
The final version of the globe animation went live the same day that the fish doorbell closed this year (July 1st), alongside the language data visualisation which stayed very similar to what Mitchell Scholte created.
It’s a relatively small addition to the site, but one that I think fits the spirit of the fish doorbell perfectly: playful, a little bit silly, and bringing people together.
Would you like to mess around with the data and make something with it yourself? FUN!!! Here’s the endpoint for the languages and the global stats. Please don’t overwhelm the server with requests 😅 and please share what you created with me on social media or by email! 🫶


