March 11, 2025
Written by: Cyd Stumpel
Finding fish in a sea of grey and green
At the start of this month one of my favourite websites went live (it has existed for a while, but I implemented the rebrand); the fish doorbell (visdeurbel.nl). The concept is really simple; a website showing a livestream at a lock in Utrecht, where users are asked to press the doorbell if they see a fish, creating a snapshot that’s uploaded to the backend.
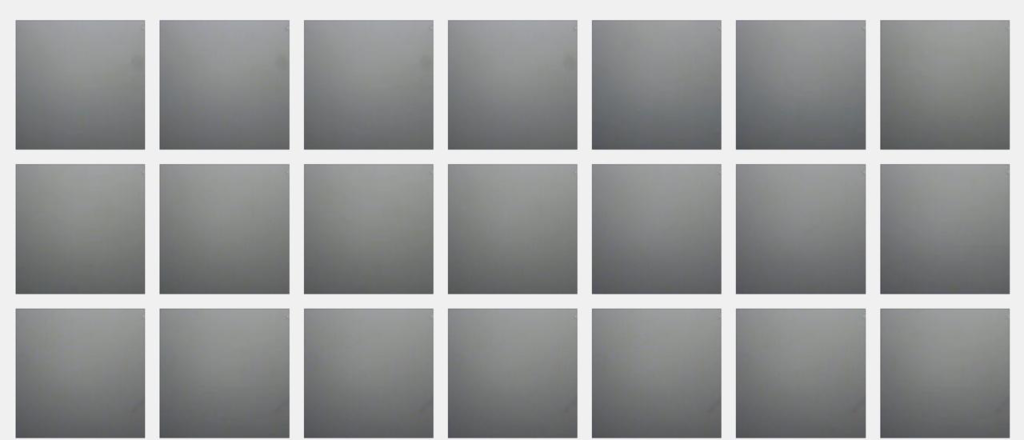
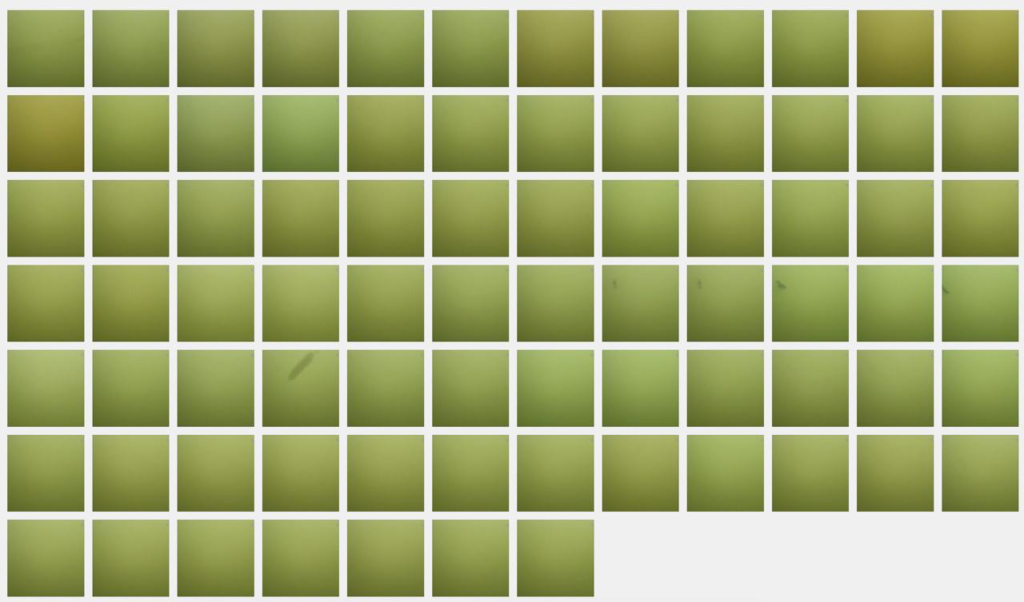
Due to the enormous amount of visitors (almost twice as many on the first day compared to last year) we got 40k images in two days. To make things worse… In the first week the water in the river was still very cold and there were no fish visible on the livestream. I went through 40k grey- and green mostly completely empty images by hand, to delete the empty ones and give the servers some rest.

We get users from all over the world and, while our biggest user group is still from The Netherlands, it’s also very popular in the United States and UK. We’ve been getting emails from retired people touring through Australia keeping up with our little lock in Utrecht.
The Fish Doorbell has gained massive popularity over the last couple of years. At the very start, 5 years ago, an actual email was sent to the lock keeper every time someone pushed the doorbell. That would be absolute madness now, as it would result in 40000 emails.
Something had to change. I was not prepared for this amount of success, partly because it’s my first year managing this website, but also because we didn’t expect to get even more users than last year.
Several Dutch news sources started reporting on visdeurbel.nl not being able to handle all the users, and my heart jumped, thinking I missed massive downtimes. Luckily they were just talking about the livestream not being able to handle the amount of users. The livestream is capped on 2000 users at a time to also help limit the amount of users. There’s a youtube livestream visible when the maximum is reached and users are not able to ring the bell anymore. Unfortunately this still resulted in way too many empty images being submitted.
Creating a script to recognise shapes
Pressing a button is fun, we get that! And most users can’t have been aware of the strain it put on our server. The Fish Doorbell users are super loyal and well meaning, so I decided; we need to find a way to calculate the probability that there’s something visible in an image and show users a warning to not submit empty images to spare our servers.
I started searching Google for ways to detect if an image is empty, this turned up some results but they mostly required expensive Artificial Intelligence APIs. I came across a library that hasn’t been updated in 2 years called Resemble.js. This seemed like the perfect solution; it allows you to compare two images and it will return the difference.
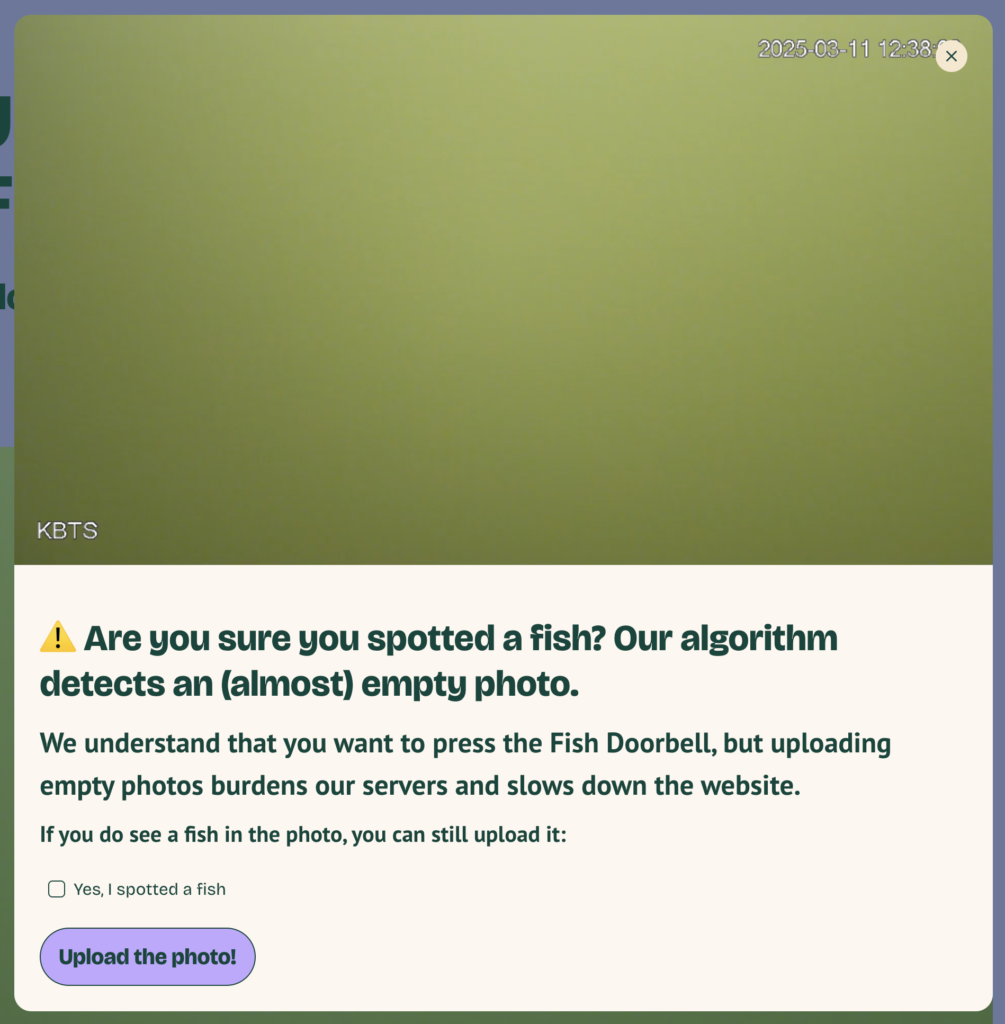
This worked great during the day, I’d compare an image to a screenshot of the empty lock, and, if it was too similar I could be sure that the image was mostly empty and show our little warning message:
Unfortunately, during the night, the light and shadows in the lock changed so much that an empty image during the day and an empty image at night were registered as completely different images.

I asked around in my network of creative developers and came to the conclusion I needed to do something called edge detection. I gave this resource to Claude in my Cursor code editor, and asked it to turn it into JavaScript. I’m sure it can be optimised greatly, but it works quite well for my use case:
/**
 * Edge Detection Module
 * Inspired by: https://tonio73.github.io/data-science/cnn/CnnEdgeDetection-Keras-Part1.html
 */

const EdgeDetection = {
  /**
   * Apply Sobel operator for edge detection on a base64 image
   * @param {string} base64Image - Base64 encoded image
   * @param {string} mode - 'horizontal', 'vertical', or 'combined'
   * @returns {Promise<Object>} - Object containing processed image and object detection probability
   */
  detectEdges: function(base64Image, mode = 'combined') {
    return new Promise((resolve, reject) => {
      const img = new Image()
      img.onload = () => {
        try {
          // Create canvas and get image data
          const canvas = document.createElement('canvas')
          const ctx = canvas.getContext('2d')
          canvas.width = img.width
          canvas.height = img.height
          ctx.drawImage(img, 0, 0)

          const imageData = ctx.getImageData(0, 0, canvas.width, canvas.height)
          const result = this.applySobelFilter(imageData, mode)

          // Put processed data back to canvas
          ctx.putImageData(result.processedData, 0, 0)

          resolve({
            processedImage: canvas.toDataURL(),
            objectProbability: result.objectProbability
          })
        } catch (error) {
          reject(error)
        }
      }
      img.onerror = (error) => reject(error)
      img.src = base64Image
    })
  },

  /**
   * Apply Sobel filter to image data and calculate object probability
   * @param {ImageData} imageData - Original image data
   * @param {string} mode - 'horizontal', 'vertical', or 'combined'
   * @returns {Object} - Object containing processed image data and object probability
   */
  applySobelFilter: function(imageData, mode) {
    // Sobel operator kernels
    const kernelX = [
      [-1, 0, 1],
      [-2, 0, 2],
      [-1, 0, 1]
    ]

    const kernelY = [
      [-1, -2, -1],
      [0, 0, 0],
      [1, 2, 1]
    ]

    const width = imageData.width
    const height = imageData.height
    const data = imageData.data

    // Create output image data
    const outputData = new ImageData(width, height)
    const output = outputData.data

    // Convert to grayscale first
    const grayscale = new Uint8ClampedArray(width * height)
    for (let i = 0; i < height; i++) {
      for (let j = 0; j < width; j++) {
        const idx = (i * width + j) * 4
        // Standard grayscale conversion
        grayscale[i * width + j] = Math.round(
          0.299 * data[idx] + 0.587 * data[idx + 1] + 0.114 * data[idx + 2]
        )
      }
    }

    // Variables to track edge information
    let totalEdgeStrength = 0
    let maxPossibleEdgeStrength = 0
    let significantEdgeCount = 0
    const edgeThreshold = 30 // Threshold to consider an edge significant

    // Apply convolution
    for (let y = 1; y < height - 1; y++) {
      for (let x = 1; x < width - 1; x++) {
        let pixelX = 0
        let pixelY = 0

        // Apply kernels
        for (let ky = -1; ky <= 1; ky++) {
          for (let kx = -1; kx <= 1; kx++) {
            const idx = (y + ky) * width + (x + kx)
            const kernelValue = grayscale[idx]

            pixelX += kernelValue * kernelX[ky + 1][kx + 1]
            pixelY += kernelValue * kernelY[ky + 1][kx + 1]
          }
        }

        // Calculate magnitude based on mode
        let magnitude
        if (mode === 'horizontal') {
          magnitude = Math.abs(pixelX)
        } else if (mode === 'vertical') {
          magnitude = Math.abs(pixelY)
        } else { // combined
          magnitude = Math.sqrt(pixelX * pixelX + pixelY * pixelY)
        }

        // Track edge information for object detection
        totalEdgeStrength += magnitude
        maxPossibleEdgeStrength += 255 // Maximum possible value
        if (magnitude > edgeThreshold) {
          significantEdgeCount++
        }

        // Clamp values
        magnitude = Math.min(255, Math.max(0, magnitude))

        // Set pixel in output
        const outIdx = (y * width + x) * 4
        output[outIdx] = magnitude     // R
        output[outIdx + 1] = magnitude // G
        output[outIdx + 2] = magnitude // B
        output[outIdx + 3] = 255       // Alpha
      }
    }

    // Calculate object probability based on edge information
    const totalPixels = (width - 2) * (height - 2) // Exclude border pixels

    // Multiple factors contribute to object probability:
    // 1. Edge density (ratio of significant edges to total pixels)
    const edgeDensity = significantEdgeCount / totalPixels

    // 2. Average edge strength relative to maximum possible
    const avgEdgeStrength = totalEdgeStrength / maxPossibleEdgeStrength

    // 3. Edge distribution - check if edges form patterns rather than noise
    // This is a simplified approach - real object detection would use more sophisticated methods
    const edgeDistributionFactor = this.calculateEdgeDistribution(outputData)

    // Combine factors with appropriate weights
    const objectProbability = Math.min(1.0, Math.max(0.0,
      0.4 * edgeDensity +
      0.3 * avgEdgeStrength +
      0.3 * edgeDistributionFactor
    ))

    return {
      processedData: outputData,
      objectProbability: objectProbability
    }
  },

  /**
   * Calculate edge distribution factor
   * Checks if edges form patterns rather than random noise
   * @param {ImageData} imageData - Processed image with edges
   * @returns {number} - Edge distribution factor (0-1)
   */
  calculateEdgeDistribution: function(imageData) {
    const width = imageData.width
    const height = imageData.height
    const data = imageData.data

    // Count connected edge pixels
    let connectedEdgeCount = 0
    const edgeThreshold = 30

    for (let y = 1; y < height - 1; y++) {
      for (let x = 1; x < width - 1; x++) {
        const idx = (y * width + x) * 4
        const pixelValue = data[idx] // Just check red channel since R=G=B

        if (pixelValue > edgeThreshold) {
          // Check if any neighboring pixel is also an edge
          let hasNeighbor = false

          // Check 8 neighbors
          for (let ny = -1; ny <= 1; ny++) {
            for (let nx = -1; nx <= 1; nx++) {
              if (nx === 0 && ny === 0) continue // Skip self

              const nIdx = ((y + ny) * width + (x + nx)) * 4
              if (data[nIdx] > edgeThreshold) {
                hasNeighbor = true
                break
              }
            }
            if (hasNeighbor) break
          }

          if (hasNeighbor) {
            connectedEdgeCount++
          }
        }
      }
    }

    // Calculate ratio of connected edges to all edge pixels
    const totalEdgePixels = this.countEdgePixels(imageData, edgeThreshold)
    if (totalEdgePixels === 0) return 0

    return connectedEdgeCount / totalEdgePixels
  },

  /**
   * Count total edge pixels in the image
   * @param {ImageData} imageData - Processed image with edges
   * @param {number} threshold - Threshold to consider a pixel as edge
   * @returns {number} - Count of edge pixels
   */
  countEdgePixels: function(imageData, threshold) {
    const width = imageData.width
    const height = imageData.height
    const data = imageData.data
    let count = 0

    for (let y = 0; y < height; y++) {
      for (let x = 0; x < width; x++) {
        const idx = (y * width + x) * 4
        if (data[idx] > threshold) {
          count++
        }
      }
    }

    return count
  }
}

export default EdgeDetection
Two more issues I ran into;
- Even if there were fish in the images, they blended into the background pretty well.
- The date, time and KBTS text gave some false positives
I asked Claude to write a script to make the shadows darker, the contrast higher and the exposure higher. As well as blurring out the top right and bottom left corner to hide the date and KBTS as much as possible. This is all done on a <canvas> element.
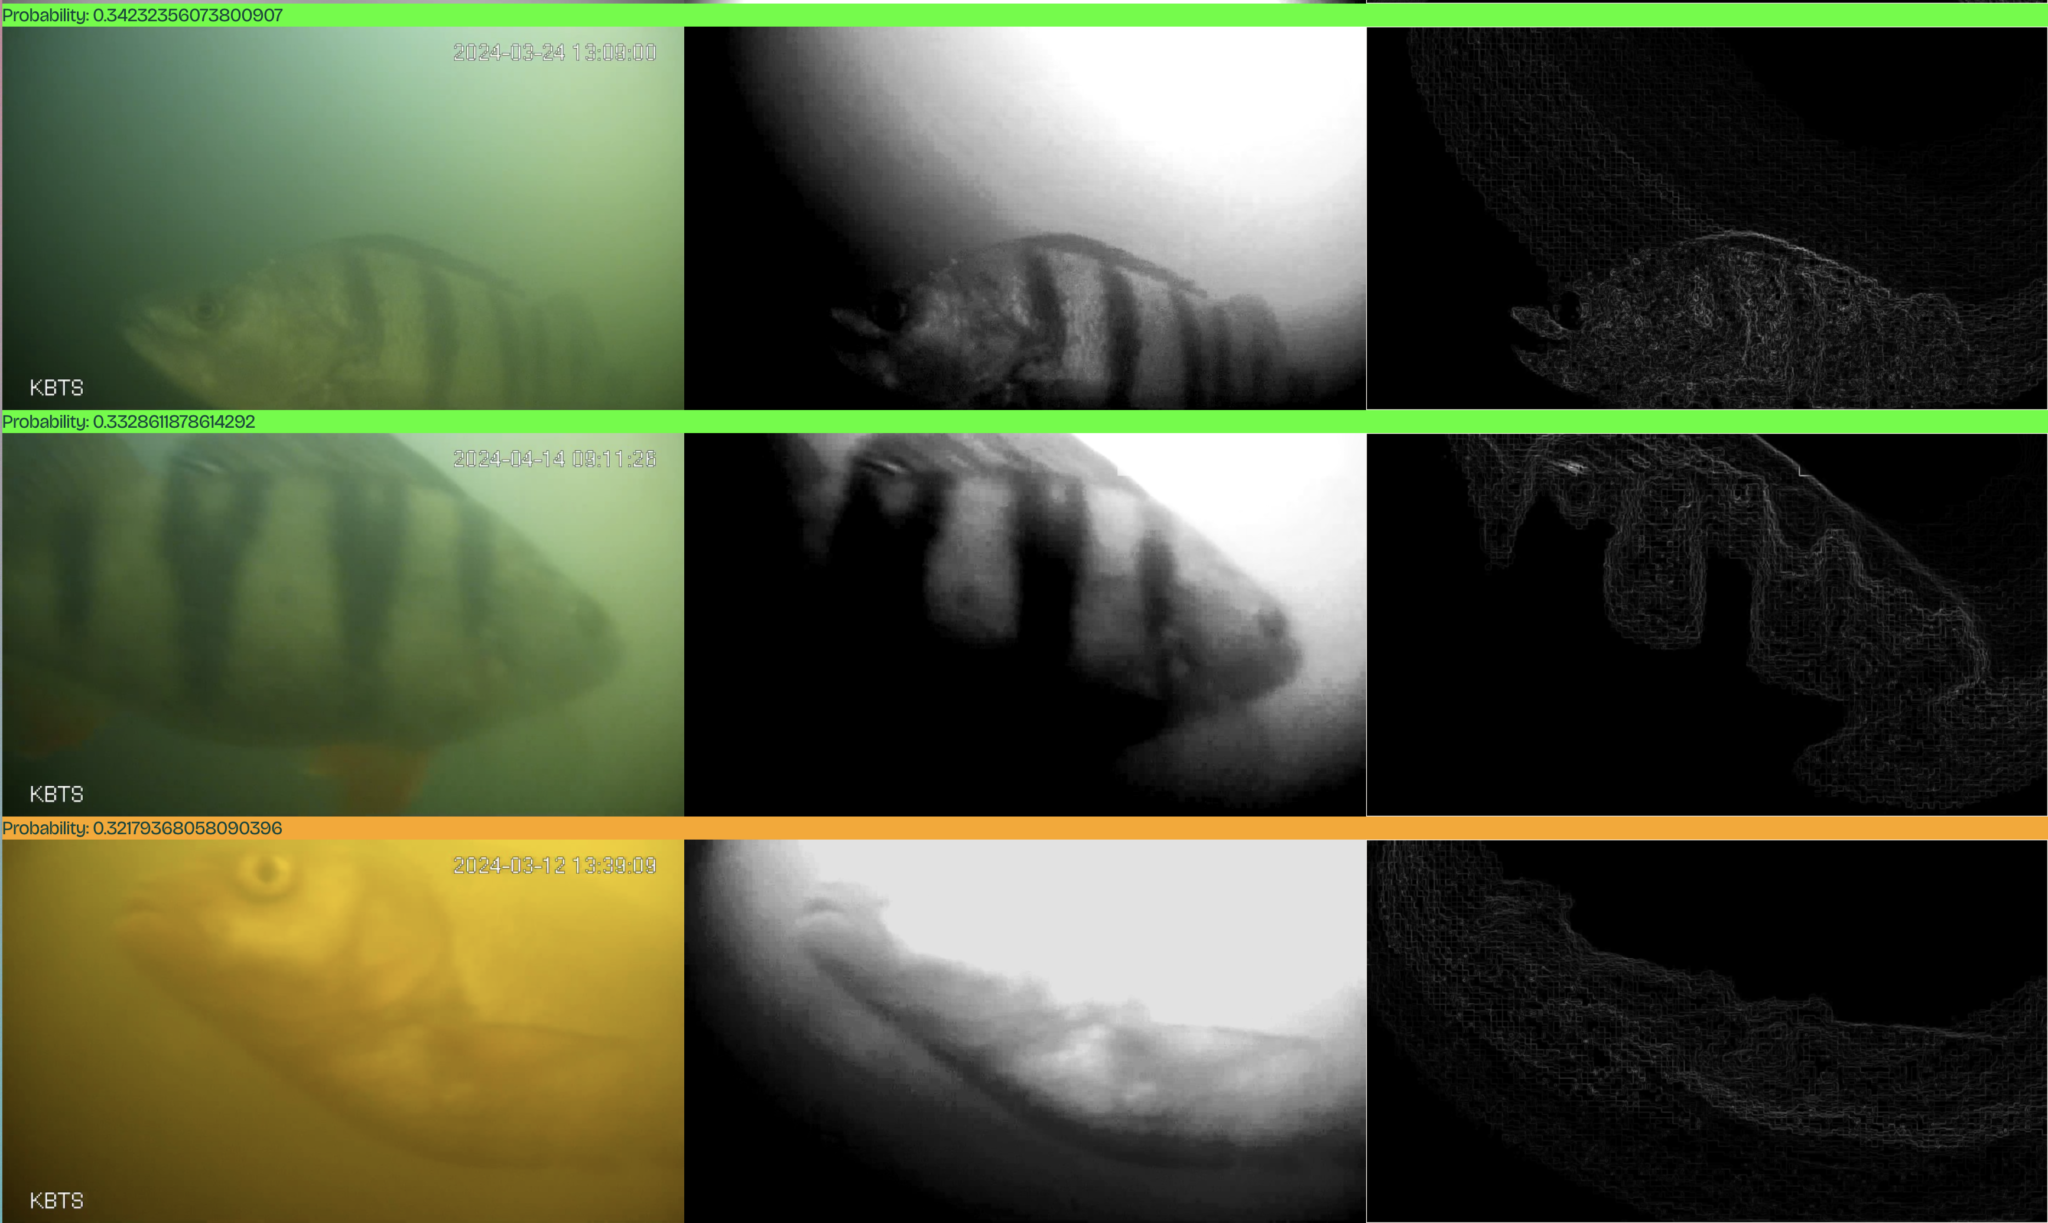
Everyone trying to upload an image below 32% will be shown the warning, it also adds a tag (high, medium, low) to the image based on the probability to help the ecologist, Mark van Heukelum with sorting through the images.
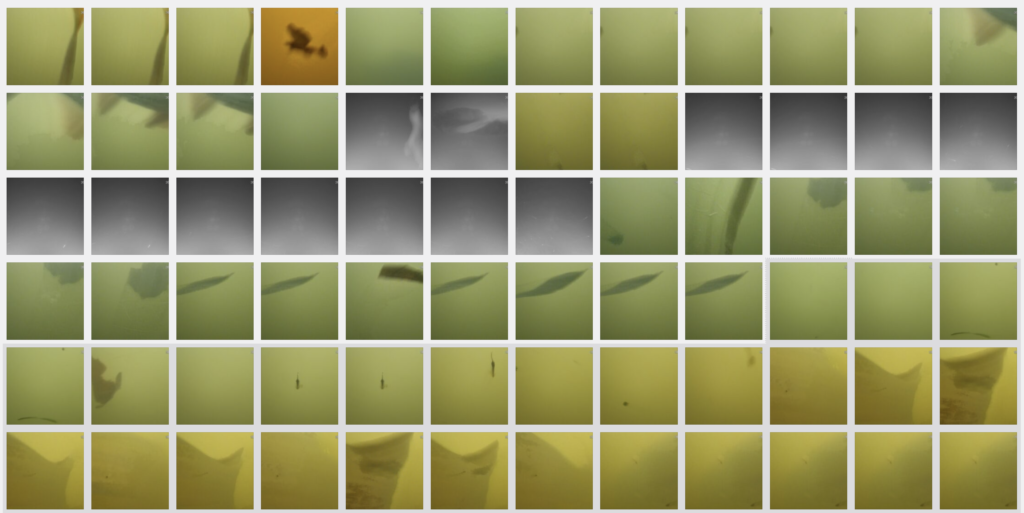
We went from ±20k images a day to approximately 1000 image uploads a day💪, we’re still seeing a lot of leafs and it’s not as good at detecting shapes when the sun is down, but it has greatly helped the amount of images we need to go through!
